

We relate a high frequency human movement dataset with a decade old Census data to find a significant relevance of the latter to current public policy discources on migration in India since Covid-19.
Human movement can be identified as migration and daily mobility. Migration captures the phenomenon of temporarily or permanently changing one’s ‘home’. Daily mobility captures only the moving aspect. Thereby, let us assume migration is a ‘stock’ while mobility is a ‘flow’.
Migration datasets are typically constructed through surveys that are expensive and cannot be done at high frequency. Machine generated daily mobility data can be obtained at a high frequency once the initial investments are made. Thereby we assume, the marginal cost of gathering these data is low. An available dataset on Indian migration is Census which is collected once in every ten years. Recent census was collected in the year 2011. Yet, the relevance of decennial data in making decisions for present times like in the event of crisis is questionable.
Do migrants return back from destination districts to their source districts?
In March 2020, India went under complete locked down due to Covid-19 pandemic, which is like none other in recent history. This has also brought the issue of migrant movements that has taken everyone by surprise largely due to the lack of knowledge about it. This lockdown has revealed the existing systemic inefficiencies and underlying structural faults of Indian governance systems which fail to ensure provision of basic needs and social security benefits to all its citizens. It is assumed that people generally migrate away from their source districts to destination districts in search of livelihood opportunities. Since the lockdown has brought India to a complete standstill, the lack of economic opportunities in destination districts have forced the migrant population to head back to their source districts where they were entitled to access Ration through PDS1 and MGNREGA.2
At India Development Foundation (IDF), we attempted to quantify migration related movements using daily mobility data. Thereby, we address the issue of ‘data deficiency’ which usually becomes a safer heaven for ‘timely inaction’ by governance systems. For this, Migration Census 2011 data is combined with high frequency near real-time dataset on daily movement of Facebook users from Facebook’s Data for Good programme. This work establishes a link that migration and mobility are related.
1. Relationship between migration and daily mobility:
Hypothesis: Taking two districts namely Mumbai in Maharastra and Jaunpur in Uttar Pradesh as an example. During normal times, we assume more people move from Jaunpur to Mumbai for economic opportunities, whereas we expect to see more movement from Mumbai to Jaunpur during crisis. Hence, we expect movement along district-pairs with more migrants to be high.
Fig-I: Correlation between gross migrants and gross baseline facebook flows
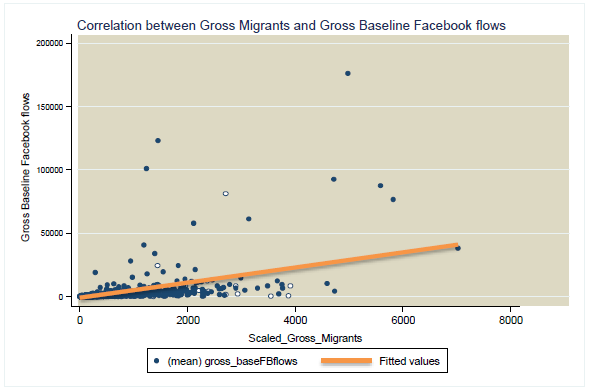
Finding: Mobility is higher along inter-district vectors within States where there are more migrants. Migration between districts is a significant driver of mobility between them. That is mobility in the present times (in the baseline, i.e. without COVID) is higher between districts that are connected by migration in 2011 data.
2. Impact of migration on mobility over time:
Situation-I : Where there is no Covid-19 but national lockdown is imposed. In the fig, it is from May,2020 – Jul,2020. Complete lockdown measures have been incrementally lifted since Aug, 2020.
Situation-II : Where there is Covid-19 but national or state lockdowns are not imposed. In the fig, it is from Feb,2021 – Jun,2021. Second wave of Covid-19 across States reached its peak in May, 2021 and vaccination drives gained momentum.
Hypothesis: During crisis, we assume on an average people will restrict their mobility wherever possible, and the mobility to rise until it reaches the baseline level (pre-crisis times). Whereas, we expect migration related movement to peak during crisis situation and vise-versa.
Fig-II: Facebook Population _ Average movement and Migration related movement over the months respectively (Ref: Calculated estimates from Table-II)
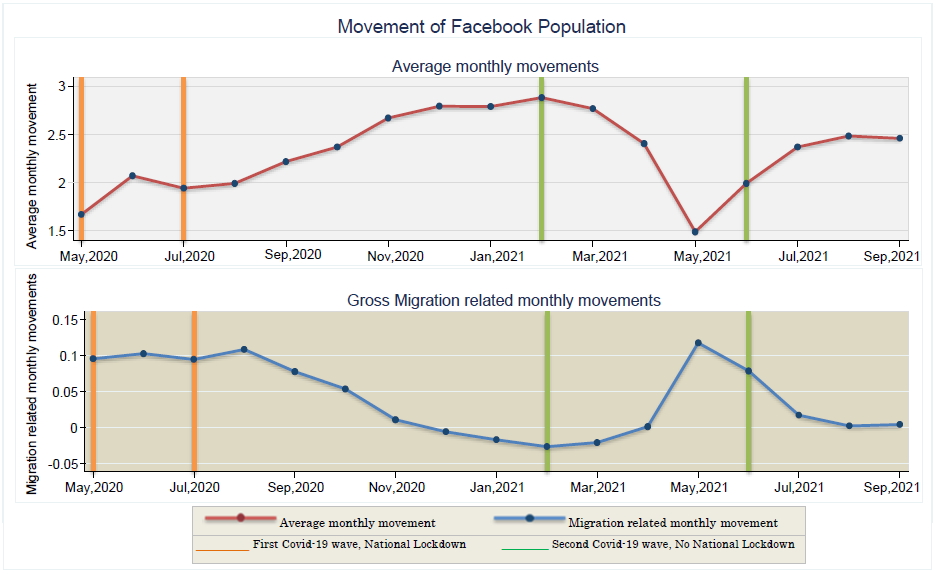
Finding: During the lockdown in 2020 and the first and second waves of COVID in India, the overall mobility falls. However, mobility driven by the underlying migrant stocks increases during COVID times.
3. What does the direction of migration related movement tell us?
Hypothesis: At any net migrant3 exporting districts, we expect inflow of migration related movements to be lesser and outflow of migration related movements to be higher during a crisis period. This hypothesis is shown in fig-III where migration related movement is further broken down into migrant inflows into source districts and migrant outflows from destination districts.
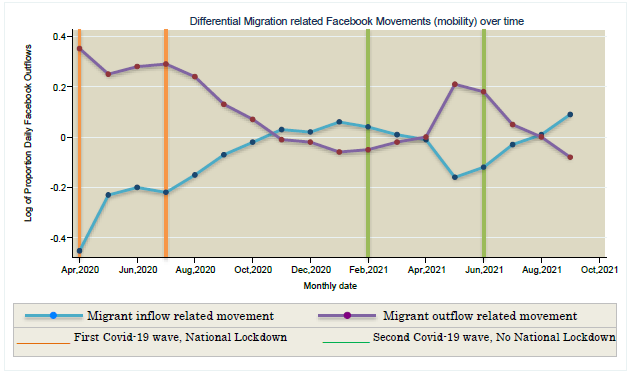
Finding: People born in A residing B is given by vector AB, which is different to BA which is different to vector BA. The research establishes that during ‘normal’ times mobility in the two directions between a pair of districts is, on average, the same. Thus, movements from district A to district B are equal to those from B to A. This makes sense - else, one district will eventually empty out! However, during COVID people moved in one direction i.e., from the districts where they were migrants (destination) to those where they were from (origin). Then as things improved they move in the reverse direction - again a one-time movement. This is the reason why migrants move more during distress times.
These three findings show that the Facebook mobility data can indeed be used to pick the long-distance distress movements of migrants. Thus, it is possible to conclude that, in times of crisis, by combining decennial data with a high frequency dataset we can depict the real timeliness of machine generated movement data. This data driven insights also accomplish the fact that there is relevant data on migration in India.
Shanmitha Raghu (sraghu@idfresearch.org) is Research Associate at the India Development Foundation.
[1]Public Distribution System is an Indian food Security System established in the year 1997 under the Ministry of Consumer Affairs, Food, and Public Distribution.
[2]Mahatma Gandhi National Rural Employment Guarantee Act 2005 (MGNREGA) by the Ministry of Rural Development, Government of India provides a legal guarantee for one hundred days of employment in every financial year to adult members of any rural household willing to do public work-related unskilled manual work at the statutory minimum wage.
[3]Net Migration is the difference between migrant stock from A to B and migrant stock from B to A. The “net” value indicates if a district is an importing district or exporting district. Positive “net” value implies importing district and negative “net” value implies exporting district.
The views expressed in the articles published on this microsite are those of their authors. The articles are not peer reviewed. While we have made sincere attempts to verify the facts presented in the articles published here, we do not vouch for their veracity or accuracy.