
Increasing numbers of sectors, including businesses, banking, health, and education, are exploring potential of online space. But how far do online platforms connect in terms of physical distance. This article investigates the usage patterns of online social networks within and between districts in India.
Individuals are social beings. We communicate to express ourselves and to connect with others. We connect with immediate family, extended families, friends, colleagues from work places, product and service providers, consumers of our products and services, and others. We connect to be mutually informed about resource and/or crisis management apart from seeking moral support from one another. Sometimes we just connect because that is perhaps our nature.
Broadly, we can connect with others by making personal visits, or via telephonic conversations, or virtually connect via social media platforms. This brings us to social connectedness through offline and online means. Presumably, offline connectivity is limited by space and time implying more geographical distance between two places, we expect relatively less social connectivity between the two places than those that are located geographically closer to each other. Online connectivity surmounts the challenge of space and time provided all the necessary physical infrastructures to enable online connectivity are present at respective regions of the connecting individuals. But is this really true?
It’s interesting to ask what the geographical distribution of online social connections is. Knowing this would help in understanding the reach of offline and online connectivity across geographical regions in relation to physical distance. Here is how data from social media platforms are helpful in obtaining necessary insights. Geolocation information is picked up from physical electronic device’s location by few online social media platforms with prior permissions from its users. The de-identified and aggregated geolocation data when shared by the social media platforms either publically or with requests can be used to understand the ‘where’ part of social connections among people via online platforms.
The analysis
To observe the likely online social connectedness patterns, we use the Social Connectedness Index (SCI) which is a publically available dataset from Facebook. It gives the intensity of Facebook friendship connections among individuals from two places. Our interest in this article is to understand social connectedness between and within districts in India. For this, we use the recent SCI calculated as of August 2020. Straight-line or crow-flight geographical distance between centroids of two districts is used as a measure of physical distance between them.
Social Connectedness Index between two districts is derived by dividing total number of Facebook friendship connections between individuals from the districts with the product of Facebook users in the two districts respectively. The publicly available SCI are scaled within each dataset to have the values in a range between 1,000,000,000 and 1. As a result, SCI captures the relative probability that two random Facebook users from two districts are friends with each other. For example, scaled SCI between two district-pairs Kollam-Pune and Kollam-Kolkata are 100 and 200 respectively. The scaled SCI values imply that Facebook users from Kollam are twice likely to be connected with Facebook users in Kolkata than with Facebook users in Pune. To ensure data privacy, a small amount of random noise is added to the measure and rounded to the nearest integer, thereby no single individual or friendship link can be identified from the data.
The findings
Following are the findings from the analysis for the State of Tamil Nadu, but the results hold for all States in India. Representativeness of scaled SCI is presented in Fig I. It is seen that the strength of online social connectedness within districts is more than the online social connectedness between district-pairs within and outside the State. For example, the relative probability of a Facebook user in Chennai connecting with another Facebook user within Chennai is 64 times more than the user connecting with a Facebook user from other districts. Similarly, the relative probability of a Facebook user in Chennai connecting with another Facebook user from another district inside the State is 35 times more than the user connecting with a Facebook user within Chennai or from a district outside the State. On an average in the State of Tamil Nadu, the relative probabilities of Facebook users connecting between district-pairs within and outside the State are 4% and 1% respectively. The relative probability of Facebook users connecting within a district is 95%.
As districts become richer and grow at a faster pace, the cumulative share of online social connections within districts is seen to be relatively lower when compared to districts that have started to grow or where the scope for economic growth is yet to be tapped by both the State and the market. This is also depicted in Fig I where the districts within the State are classified as tier-I, tier-II, and tier-III based on total population as of Census 2011 by Seventh Central Pay Commission. This classification is used by the Government of India to allocate House Rent Allowance to public servants employed in districts in India. For this analysis, this classification is considered as a proxy to account for economic differences between districts within the State. We observe that the intensity of online social connectedness within tier-III districts is more compared to districts in tier I and tier II categories. There is least online social connectedness within tier-I district. We infer that as developed districts are outgrowing, it results in relatively more economic opportunities and social connections within districts in the tier-II and tier-III categories respectively.
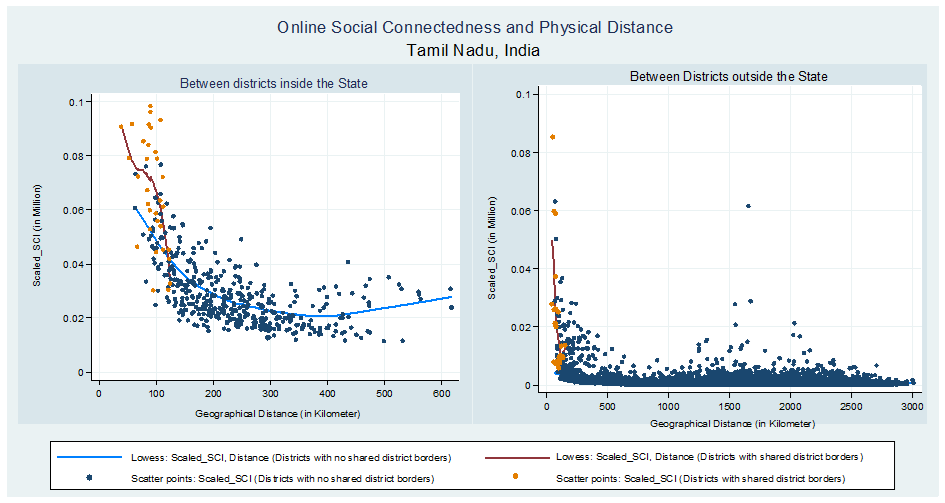
Fig II gives the relationship between online social connections between districts within the State (left panel) and outside the State (right panel) with respect to physical distance respectively. The distinction of within State and outside State analysis is done to account for historical ties, political boundaries, and public services like better health and education system, job opportunities, and others offered by the States respectively which can potentially impact the social connectedness between districts. This distinction is further considered as a proxy to account for cultural differences between districts from within and outside the States.
We observe that online social connectedness falls with physical distance. Each scatter point represents the scaled SCI between a district-pair. Lowess curve which is a locally weighted scatterplot smoothening gives a curve of best fit without assuming the data to any type of distribution. In our analysis, the lowess curves overlaid on scatter plots show that SCI does not fall lineally with distance.
For district-pairs that shares common district borders, we observe steep downward sloping lowess curves. It indicates that there is higher online social connectedness at lower distances between district-pairs that shares common district borders, and as distance increases there is an evident fall in the online social connectedness. This suggest that physical distance matters more for district-pairs that shares common district borders than those that do not, and scaled SCI is lower between two larger districts. The findings hold true for district-pairs within and outside the State. For district-pairs that shares common district borders, it is observed that on an average any distance beyond 400km does not influence online social connectedness between districts within the State which is inferred from the ‘U’ shaped lowess curve. In relation to physical distance, if online social connections were with same type of people as offline social connections then the ‘U’ shaped lowess curve translates that the overall benefit of social connectedness is more than the total cost of social connectedness.
Conclusion
Going back to the question of whether online social connectivity is different from offline connectivity. With help of SCI data we observe that there is an inverse relationship between online social connections and geographical distance across geographic units at district level in India. That is, among other influencing factors for online social connectedness, more the physical distance between two districts, there is less social connectedness between individuals from the districts. The result holds true for district-pairs that share common district borders and for those that do not. Thus, the reach of online connectedness between districts in India is similar to our initial assumption about the reach of offline connectedness in relation to physical distance.
Information flows along networks, if social connectedness within districts especially in tier-III districts connects only with themselves, then how information can flow freely. This further stimulates us to think if cultural and economic ways of lives do not change, then how do we expect change in online social networks.
Why is this important question to ponder? Given online space after meeting all its obligatory guidelines on user privacy and security can help in reduction of transactional costs in providing and receiving any feasible products and services. In this time of on-going pandemic, we find more and more sectors including businesses, banking, research organisations, health, and education systems continue to explore the potential of online space. Hence, it becomes necessary to understand the characteristics of social networks and the factors other than physical distance that influence the reach of both offline and online social connectedness between places. This will help us plan and expand the distribution of essential products and services using appropriate social network platforms with relatively less transactional costs that benefits the public at large.
Fig I: Distribution of Social Connectedness Index
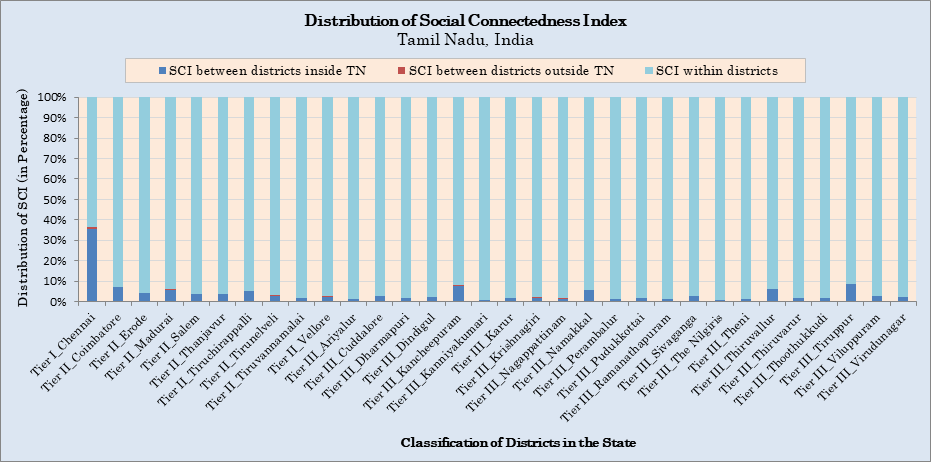
Fig II: SCI and Physical Distance between districts within Tamil Nadu using Scatter Plots and Lowess curves
Shanmitha Raghu (sraghu@idfresearch.org) is Research Assistant at the India Development Foundation.
The views expressed in the articles published on this microsite are those of their authors. The articles are not peer reviewed. While we have made sincere attempts to verify the facts presented in the articles published here, we do not vouch for their veracity or accuracy.