This article establishes the link between people’s movement and Covid-19 cases. When Covid-19 cases are on the rise, movement in urban districts reduce. But remain the same in rural districts.
We are interested in understanding how people moved during the spread of Covid-19[i] and how this movement was related to case-load in India. This analysis can help design policies to mitigate the spread of the pandemic. We hypothesise that rural districts would behave differently than non-rural districts. Therefore, we study them separately. The districts were not selected randomly but were chosen in a way to ensure that the representation manifests all parts of the country.
We use movement data from Facebook and Covid-19 data from a volunteer-driven, crowd-sourced database[ii]. Our focus here is intra-district movements and the evolution of Covid-19 cases over time. These movements would vary significantly given the socio-economic characteristics of an area. Rural and non-rural areas might behave differently because the former is predominantly an agrarian society while the latter is a mix of industrial and service sectors. What this means is that maybe in rural areas concepts like work from home would not be reasonable whereas in urban areas a large population would be able to work from home. Also, agriculture is a seasonal activity and hence movement should be higher during sowing and harvesting seasons.
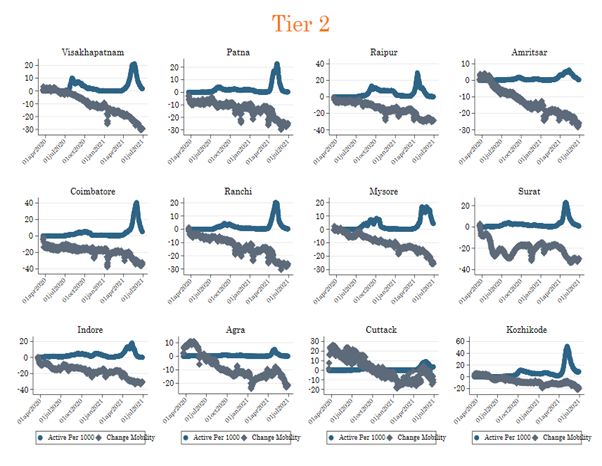
Figures 1 to 3 show the change in movement in some districts in India. A lot of districts in Figures 1 and 2 behave similarly, and these districts are predominantly urban Take Chennai for example. We see mobility declining before active cases start increasing. This is true for both waves. People were able to decrease their movement because a majority of the workers and firms started working from home. Obviously, from March 2020 to July 2020, the entire country was in lockdown. But even when things started to open up, within district movements in Chennai were on an average 20% lower than the baseline period.

It would be beneficial if all urban areas behaved as we wanted, however, that is not the case. Take Agra for example. Despite a nationwide lockdown, the within-district movement was higher during March 2020-May 2020. But that can also be because Agra had very few cases of Covid-19 during that part. As the Covid-19 cases eventually started to increase[iii], people started to restrict their movement. Within district movement in Agra started to increase from ending January 2021, however, it fell again after the second wave in ending April 2021.

To further strengthen the argument, we find a negative relationship between the increase in active cases and the change in mobility through regression. Meaning that people in predominantly urban districts do decrease their movement when the risk of getting infected rises. This negative relation holds even when we control for the lag of movement and district fixed effects.
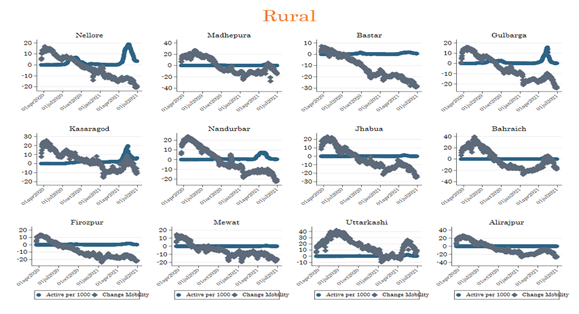
We do a similar exercise for the predominantly Rural districts. In the figure below, it is difficult to establish a relationship between change in movement and Covid-19 infections. During lockdown (March 2020-May 2020) all the districts had higher movement than baseline. And then it slowly started to decrease sometime in May/June 2020. This is irrespective of whether Covid-19 cases were increasing or decreasing. We verify this claim using regression and find that once we add the lags of change in movement to the equation the coefficient for active cases becomes insignificant. Implying that change in risk of getting infected doesn’t impact the way people move in rural districts.

The reasons for this difference can be many. Some of them have already been mentioned here – Economy of urban and rural areas differ, therefore exhibiting a differential response. It can also be linked to literacy. More literate people are more aware of their surroundings and hence decide to stay indoors when a communicable disease spreads. Moreover, since urban areas tend to have a higher portion of literate people, the response to infections is better in those areas.
Another possibility can be the fact that rural areas were not widely impacted by the virus. The number of infections was not so high that forced people to decrease their movements. Even after the second wave, only a small portion of the population was infected with the virus (around 2-3% reported). Possibly many districts would have had only a small number of cases. In that case, maybe the risk of infection is not so high as to force people to rethink their movement.
This difference can also be because of the nature of the data used. Maybe data from Facebook is not representative especially in the rural areas. And therefore, the movement of people doesn’t seem to be related to the Covid-19 caseload.
Nevertheless, one thing that the data tells us is that rural and urban districts behave differently. It is therefore important to ask should the response from the Government be the same for the entire country. The findings from this article suggest that it might be better to design region-specific policies depending on the economy, the costs, and the ease of enforcibility. If a region is agrarian, then probably a blanket lockdown would be very costly. People would have more difficulty in following government guidelines. By ease of enforcibility, we mean taking into account the situation on ground and not copy-pasting policies from other regions. Night curfews might make more sense in urban areas, implementing them in rural areas might not be useful at all. If an area has very low number of cases, then probably the motivation for people and the local administration to follow strict lockdown guidelines might be lower. In such a case creating micro-containment zones would be a better idea.
Shafin Shabir (snaik@idfresearch.org) is Research Assistant at the India Development Foundation.
[i] By active cases we mean, “Confirmed Cases- Recovered – Dead”
[ii] Covid-19 India , https://api.covid19india.org/
[iii] It is difficult to see the increase in active cases in the graph because of the scale. But when we look at just Agra, we see a decrease in movement when active cases started to increase. Also because of the nature of Covid-19 reported cases are generally a lower estimate of the actual infections. But a voluntary decrease in mobility can be seen as a response from the people to increasing infections
The views expressed in the articles published on this microsite are those of their authors. The articles are not peer reviewed. While we have made sincere attempts to verify the facts presented in the articles published here, we do not vouch for their veracity or accuracy.